Data Scientist Career Path
- 1Python for Data Science
- 2Data Analytics: Statistics & Data Visualization
- 3Introduction to Machine Learning
- 4Introduction to Deep Learning & Neural Networks
- 5MLOps: Deploying Machine Learning & Deep Learning Models
Enough statistics to stop misreading numbers, and charts that tell the truth about them.
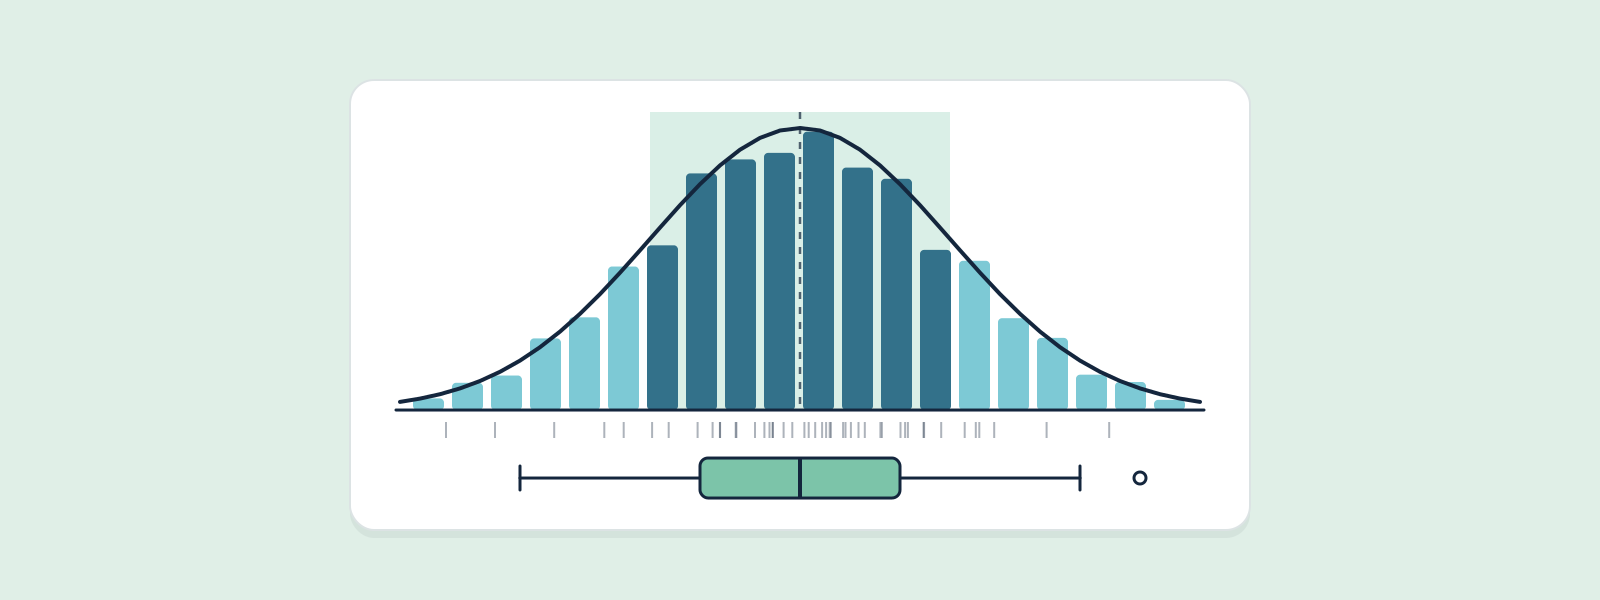
Two halves. Statistics: correlation, Bayesian thinking, sampling distributions and hypothesis testing — chosen because they turn up most in real work and go wrong most often. Visualization: picking the right chart for the question, reading a distribution off a histogram, and spotting a misleading chart before you make one yourself. Every idea has a simulation you can drag, because a p-value and the central limit theorem are things to watch happen.
Read a free lesson: What Correlation Actually MeasuresEvery module and lesson in this track. Lessons marked free are open to everyone; the rest open once you own the track.
Every lesson in this track, with summariesWhat r measures, what it does not, and when it lies.
Why sample means behave so predictably, what a p-value really means, and how much data you need.
Designing, running and reading product experiments — including the mistakes that make the results meaningless.
Reading coefficients, controlling for confounders, and checking whether a regression can be trusted.
Plot first, summarise second — and choose a chart from the question you are answering, not from a menu.
The anatomy of a matplotlib figure, statistical charts with seaborn, and interactive charts with plotly.
Designing dashboards people actually use, choosing KPIs, and presenting findings as a story.
Truncated axes, dual axes, cherry-picked ranges — how to spot them, and how not to make them.
The real one, from a lesson — it runs in your browser. No account needed.
This track is part of a larger path. Buy the whole path as a bundle and every track in it costs 40% less.